Browse help
What is the Products & services report for?
This report ranks what you sell: your best-selling products and services, the share of each in your revenue, the breakdown by category and a table of the last 12 months.
Example. Salma runs a communication agency in Rabat. Over the quarter, the report shows her that "Social media management" accounts for 48% of her revenue excl. VAT, far ahead of logo design. She knows where to focus her sales efforts.
Menu Rapports → Produits & services (Reports → Products & services). This report depends on your subscription: if it is not included, it does not appear in the submenu, its card in Rapports → Vue d'ensemble (Reports → Overview) shows a padlock with the name of the plan that offers it, and the page shows « Disponible à partir du plan … » (Available from the … plan) and a « Voir les plans disponibles » (See available plans) button. It does not appear in the external accountant's menus, whose access focuses on financial reports.
1. What is counted
- Issued invoices whose issue date falls within the period, excluding drafts and cancelled invoices.
- Valid credit notes issued in the period are deducted on their issue date (quantities and amounts). An invoice cancelled by a credit note stays in its period; the credit note offsets it on its own date.
- Comment lines are ignored. A line entered without a catalogue item appears under its label.
2. Reading the report
- Choose the period at the top of the page. By default, the report opens on « Ce mois » (This month); you can choose « Mois dernier » (Last month), « Ce trimestre » (This quarter), « Trimestre dernier » (Last quarter), « Cette année » (This year), « Année dernière » (Last year) or « Personnalisé » (Custom).
- Read the four cards at the top (details below).
- The « Évolution du CA » (Revenue trend) chart shows the period's revenue, by day (period of one month or less), by week (up to 3 months) or by month beyond that.
- Scroll down to « Top produits & services » (Top products & services), « Par catégorie » (By category) and « Tableau mensuel (12 mois) » (Monthly table, 12 months).
| Card | What it means |
|---|---|
| Total HT (Total excl. VAT) | The total excl. VAT of the period's invoices, minus credit notes. |
| Total TTC (Total incl. VAT) | The same total, all taxes included. |
| Quantité (Quantity) | The total quantity sold (net of credit notes), with the number of different products and services. |
| Panier moy. (Average basket) | The average total excl. VAT per invoice over the period (credit notes are not deducted from this average). |
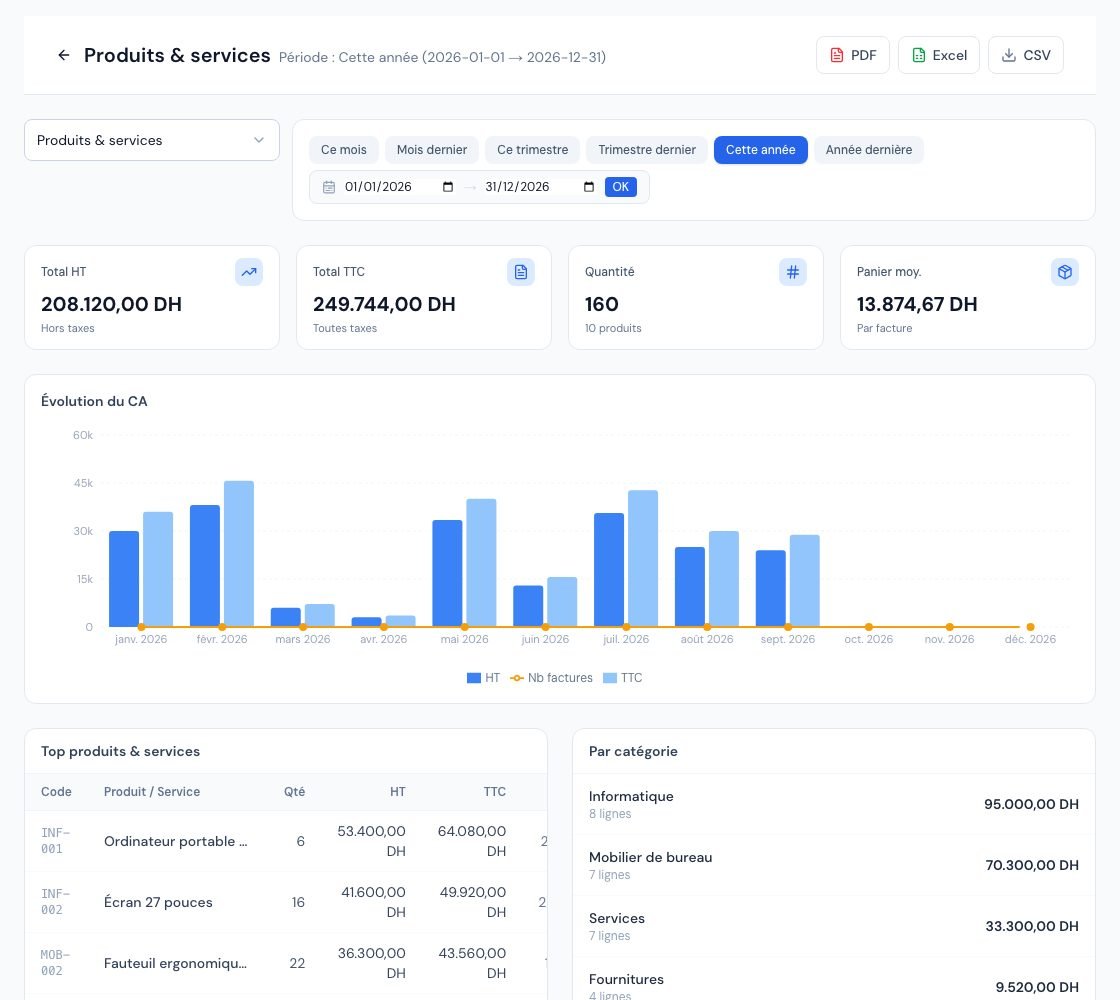 The « Produits & services » (Products & services) report with the cards and the sales chart.
3. The « Top produits & services » table
It lists the top 15 products and services by revenue excl. VAT, with the columns Code, Produit / Service (Product / Service), Qté (Qty), HT (excl. VAT), TTC (incl. VAT) and % CA (% of revenue: share of the period's total excl. VAT).
When an invoice (or a credit note) has a global discount, it is spread over its lines in proportion to their amount. The excl. and incl. VAT columns of each item, like the « Par catégorie » (By category) block, are therefore amounts after global discount: added up over all items, they match the card's « Total HT ». It is the same allocation as in the Margins by item report. As the table only shows the top 15 items, its sum may remain lower than the total.
4. The « Par catégorie » and « Tableau mensuel » blocks
- Par catégorie (By category): the total excl. VAT per item category (after global discount), with the number of invoice lines. Free lines and items without a category are grouped under « Sans catégorie » (No category).
- Tableau mensuel (12 mois) (Monthly table, 12 months): it always covers the last 12 months, whatever the period chosen. For each month: Factures (Invoices, number), Total HT, Total TTC (net of credit notes), Encaissé (Collected: already paid on the invoices issued that month) and Solde (Balance: still to be collected on those invoices). An invoice cancelled by a credit note counts neither in collected nor in balance.
5. Exporting the report as PDF, Excel or CSV
| Button | Content | Availability |
|---|---|---|
| Opens a preview of the report, with the « Imprimer » (Print) and « Télécharger » (Download) buttons. | Depending on your subscription (PDF export of reports). | |
| Excel | An .xlsx workbook with the « Résumé » (Summary), « Par produit » (By product) and « Mensuel » (Monthly) sheets (and a « Société » (Company) sheet with your details). | Depending on your subscription (Excel export of reports). |
| CSV | The « Top produits & services » table and a TOTAL row, with « ; » as separator. | Always available. |
A greyed-out button indicates an export not included in your subscription: hover over it to read « Disponible à partir du plan … » (Available from the … plan).
Frequently asked questions
Is the TTC amount the VAT to declare?
No. This report is for sales tracking; the VAT amounts derived from it are indicative. For VAT, use the VAT report and have your figures validated by your accountant.
Why does an item have a negative quantity?
A credit note issued in the period relates to a sale from an earlier period: its quantity is deducted while the original sale is not in the chosen period. Widen the period to see the net effect.
The monthly table does not change when I change the period: is that normal?
Yes. It always shows the last 12 rolling months. The cards, the chart and the tables above follow the chosen period.
I cannot see all my items.
The table only shows the top 15. To see items that do not sell, open the Unsold items report.
Next steps
Related articles
Was this article helpful?
Invoice compliantly, effortlessly
DGI-compliant invoices, quotes, credit notes, VAT and supplier tracking in a single tool.
Try it free